I am going to change direction this week. My previous posts did not seem to be very effective in engaging reader participation, so I want to try a different approach. I want to discuss something I call the healthcare dilemma. The healthcare dilemma I am referring to is the problem with missing data.
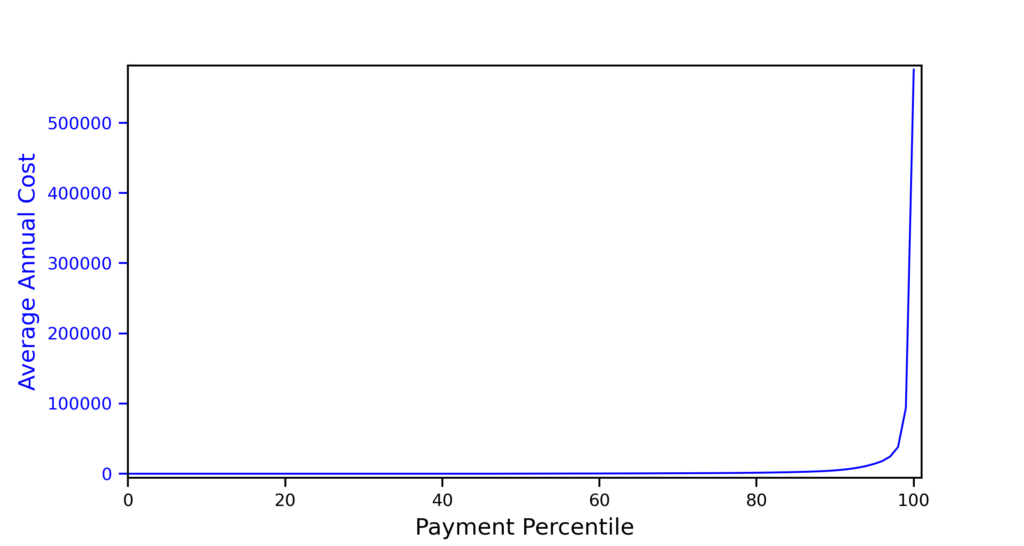
Recall that I had suggested that we need to understand how the healthcare cost distribution arises if we want to be able to effectively change the cost structure. The problem is that we have an over abundance of data on a few patients and no data from a sizable portion of the patients. In the data I was using from a medium size healthcare system, 45% of patients seen in the past 3 years did not show up in the last year. See below.

The Missing Data Problem
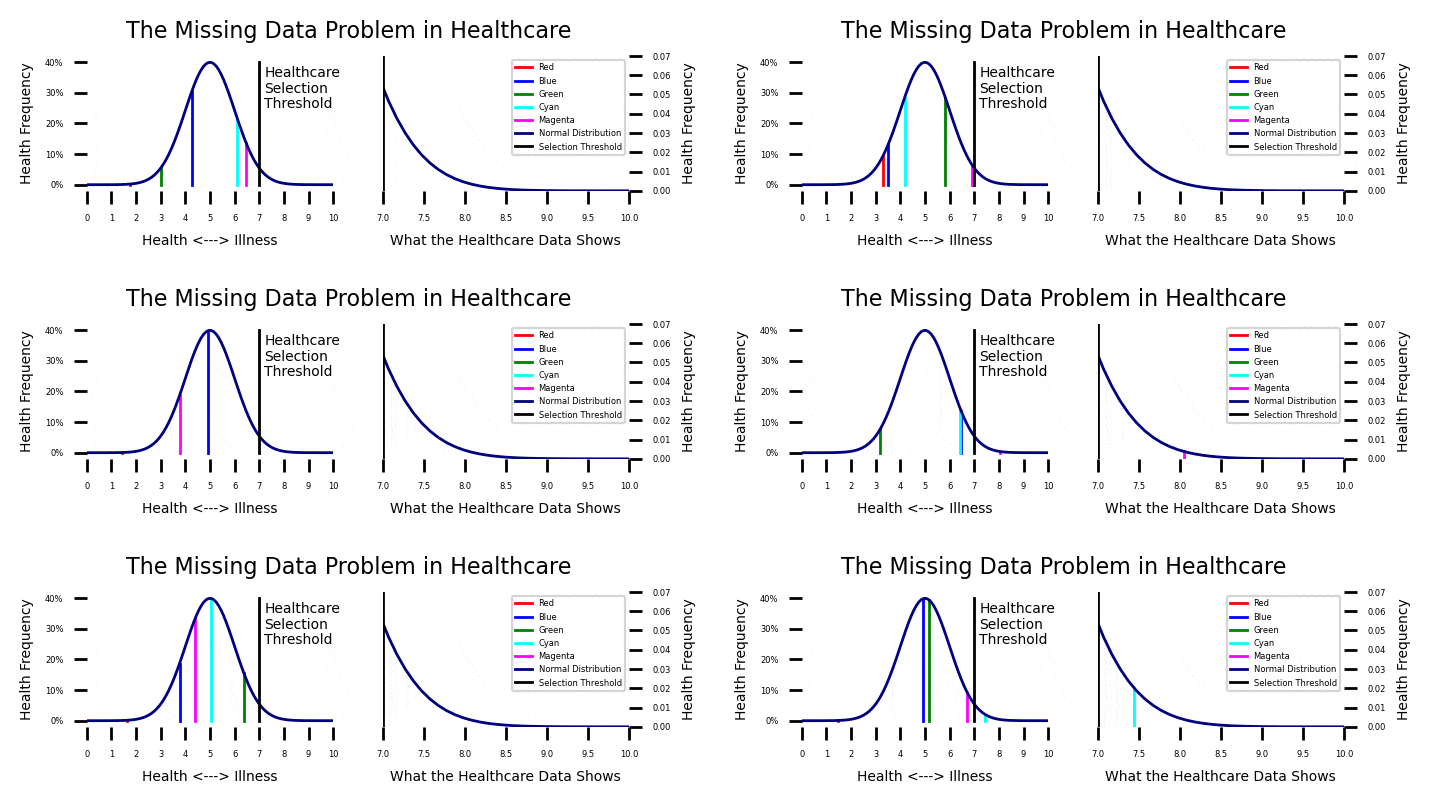
The fact that 45% of the patients have no data, and most patients have limited data creates a missing data problem. I have been working on this problem for some time, and the most accurate health care model I have been able to devise is something I call the “dynamic normal” distribution. This is based on the premise that health is both dynamic and normal.
If you look at the plot on the upper left of this post, you will see the instantaneous health of a sample of patients with the names Red, Blue, Green, Cyan, and Magenta. Their health levels are constantly fluctuating within the parameters of a normal distribution. You should be able to relate to this. Some days you feel great, and some days you don’t. Your health normally fluctuates.
Most of the time, your health is pretty good and you don’t need a doctor. If you get seriously ill, you might “cross the line” and have to interact with the health care system. I expanded the health care interaction case on the upper right. Every so often, one of our patients get ill enough and they have to interact with the healthcare system.
The Key to Improving Risk Ranking
The key to improving risk ranking is to recognize that health is “dynamic normal.” The annual health care cost plot shown above is generated from a dynamic normal distribution. It is a relatively simple matter to transform the nonlinear cost values to a linear patient rank variable and use that linear variable as the outcome rather than the cost. In regression, linear and normal is always better than nonlinear and highly skewed.
Transforming the nonlinear skewed cost to a normal linear patient rank variable increases the patient health ranking accuracy by 50%. I have been struggling to get people to understand this.
Health is dynamic normal. This creates a health care measurement dilemma. We need to understand the nature of health before we try to change it.
There is one more piece to this puzzle that is related to differences in fluctuation levels. The health of high risk patients fluctuates more than the health of low risk patients. I will try to address this topic it in future posts.

Recent Comments